Who blames the sum of mathematical
certainty it feeds on confusion, and never will
put silence the contradictions of sophistical
sciences, with which one learns the eternal
noise.
Leonardo Da Vinci, Literary writings
In a country where cultural participation generates alarming negative numbers (in 2015, 68.3% of the Italian population has never entered a museum [1] ), it becomes crucial to understand the new public and study suitable strategies for a cultural proposal able to better reflect their interests. Indeed, although this percentage is on the rise compared to the trend of recent years, there is a kind of cultural impoverishment, which concerns not only the museum, but also publishing, theater, music and dance. The 88.3% of the total population of our country in 2015 has never attended a classical music concert, 78.8% have never seen a play, 51.9% have never read a newspaper, 56.5% has never opened a single book [2].
It has often been attempted to reduce analysis of public museum culture to a series of data, more or less accurate, more or less exemplary, rather than to a basic theory that you intend to demonstrate and posit as a significant idea and a related cultural marketing strategy. It will be to demonstrate, id est, with the data, the validity of an idea, sometimes deforming the correct reading and interpretation. What is sometimes forgotten is the exact opposite: the need to gather facts on a phenomenon under investigation, and then let the data talk, so that a sense can be drawn from their links and their possible interrelationships.
In his “L’analyse des données”, Jean- Paul Benzecri, founder of a scientific discipline related to data analysis, wrote: «The model must follow the data, not vice versa [3] ». It is then the daunting task for the researcher to find a connection, if any, between numbers which may be sometimes discordant or present apparently low affinity.
With the objective of outlining a possible intervention framework about visitors to museums in Italy, I attempted to develop several statistical models, using Istat and Mibact tools, available online freely [4] . The results obtained show how state museums’ visitors are influenced more by variables related to the regional dimension (calculated as the extension of the territorial area, according to the map stock available on Istat) rather than the total resident population, as noted in a previous study[5].
As for the visitors of the non-state sites, it is possible to confirm that these are composed mainly of tourists but also in this case a fundamental discriminating factor is always the regional dimension.
In order to extend these outcomes and develop them within a broader basis of data (cultural demand to square kilometers, cultural demand of total assets, household expenditure for culture, total revenue of the museums, the total expenditure in the area)[6], again by using the Multiple linear regression [7] with the help of freeware software R, several other models were created. These models first used the 2009 data, followed by the most up-to-date (from 2013 to those just published by Mibact relative to 2016). The results obtained confirm that the total number of visitors to state museums in Italy comes from the number of cultural sites and the amount of cultural demand to square kilometers (the latter is calculated as the ratio between visitors and regional surface).
Thus it can be emphasized that it is the regional dimension which is the main discriminating factor of the model, along with total revenue, which depend not only on the total number of visitors, but also on the cultural demand/ square kilometers ratio.
This means that the more visitors there are to square kilometers, the greater will be the attractiveness of an area; but if the number of visitors, as in this case, increases proportionally with increasing surface considered, then it also means that a territory will have few visitors only because it has a smaller surface area than other regions. Or perhaps because a larger region is able to invest more resources to the development of its cultural offer?
In this regard, the construction of possible indicators to measure not only reports on the profitability of investments in Art and Culture, but also the numbers on cultural participation compared to other European and non-European countries, are needed in order to quantitatively assess the impact of the economic sector and thus be able to make concrete proposals for improving museum programming in Italy [8].
It is obvious in any event that what remains essential is the contribution made by the statistical sciences – mathematics for the important determination of the variables that affect more the numbers of Italian museums’ visitors, in order to build a valid and adequate foundation for any course of action suitable for the creation of Value, within the perspective of innovation and change in the sector of Artistic Heritage in Italy.
The goal of this work is then to evaluate the greatest degree of correlation between the purely quantitative variables inherent the Artistic Heritage and the territorial characteristics of our country, and those relating to the number of visitors to state museums. The data taken into account belong to series Istat- Mibact and range from 2009 to 2016. They will be read from a purely statistical point of view, without necessarily claiming to support an exhaustive and complete theory on the matter. After the presentation of the numerical results, will try, therefore, to interpreter the value, the most probable meaning, in order to track or suggest, to the operators of the sector, some ideas and thoughts for further investigation in the field of audience development.
We shall now go into detail [9] .
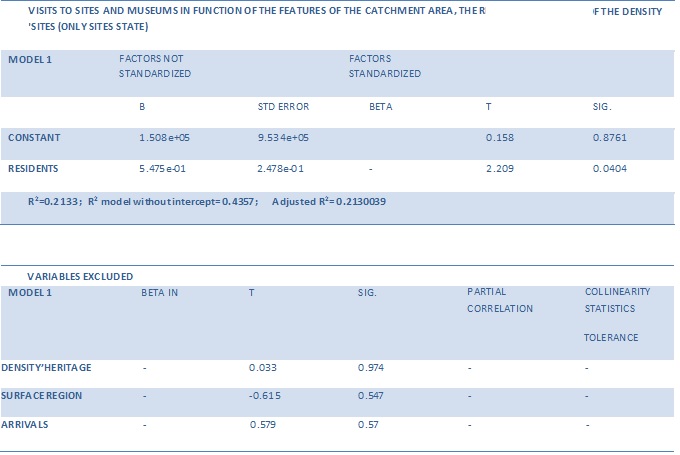
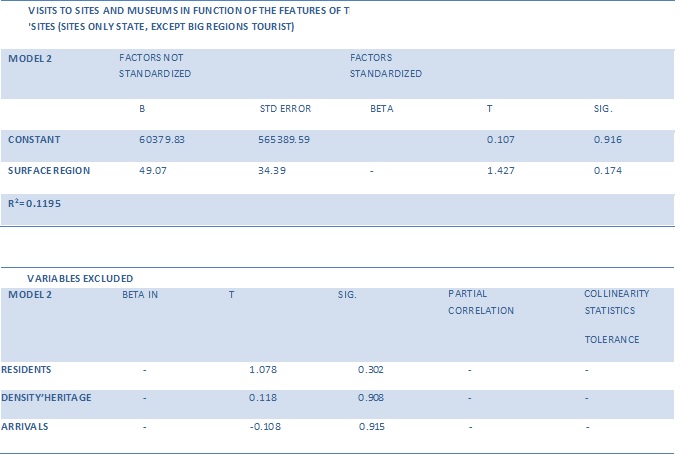
In model 1, it is easy to verify that there is a weak link between visitors and residents of the state museums (the adjusted R2 barely touches 0.21[10], while the Student’s t is around 2.2 [11]) while a relation emerges, which is believed although not much significant, between that variable and the regional area. The second model, in fact, which observes the state sites (with the exception of the great tourist regions, such as Lazio, Campania and Tuscany), shows all parameters significantly different from zero, although the R2 index is quite low, despite the presence of high sample size.
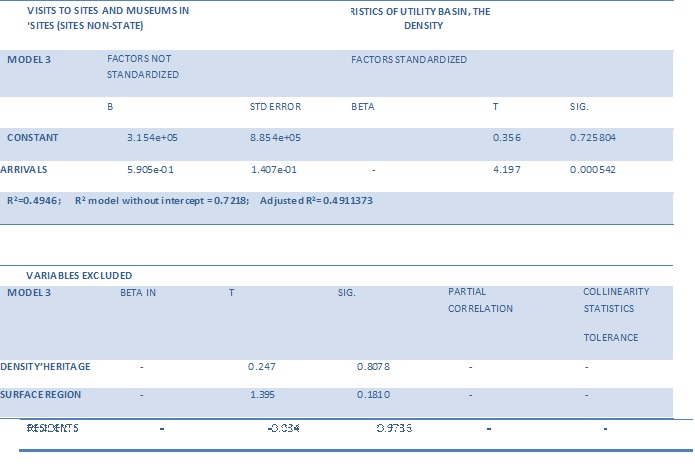
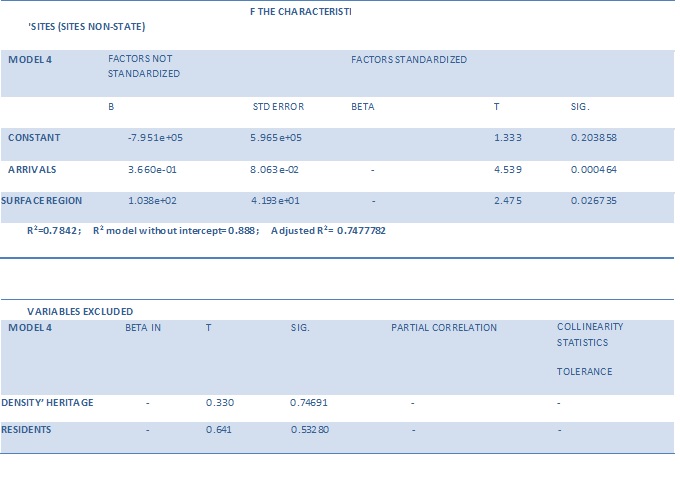
Models 3 and 4 remain the only ones with a multiple determination index greater than 0.7: there is a clear link between the non-state sites’ visitors and tourist arrivals, in addition to the surface of the considered Region. The Student-t calculations, all significant, and the R2 index confirm the excellent fit achieved. The latter is in fact able to explain at least 74% of the total variability of the unknown examined.
Always using data relating to 2009, and with the intention of analyzing the phenomenon more fully, I built a new statistical model, still choosing state sites’ visitors as dependent variable but this time analyzed with respect to other variables, selected among the most representative for the Artistic Heritage sector.
The result shows that the most significant response variable [12] (with t- value equal to 18.108 on a R2 of 0.99) and the State institution cultural demand to the square kilometer: 023 Istat indicator [13] calculated as ratio data 076 (Visitors of state institutions and art antiquities) and data 132 (surface region); worthy of note is the variable ‘Sites State’ with a t-value equal to 3.326.
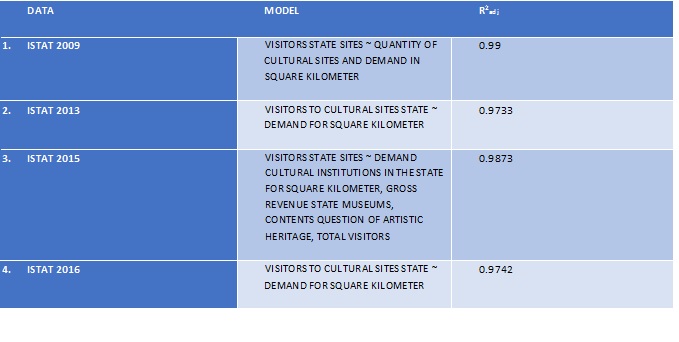
Have recourse to updated data (Istat series of 2013 for state museums and until 2011 for those non-state) for the construction of a subsequent model, there was a strong correlation in this case also among the state museums’ visitors and state sites, the government sites’ cultural demand, the state institutions’ cultural demand to square kilometers, the total number of visitors, the cultural demand index of the assets and revenues of the state museums. In this case, the adjusted R2 is equal to 0.98.
The new regression model showed a link of the variable ‘state visitors sites’ with the state institutions’ cultural demand to square kilometers and cultural demand in general. A detailed analysis of the link between public museums and cultural demand to square kilometers is possible to estimate with an adjusted R2 of 0.97.
These are then the variables that most affect the number of total public museum visitors.
What emerges is a very important issue: it is the cultural question to survey the total of state visitors, but especially the cultural demand to square kilometers, compared to the regional area; this does not mean that it is the resident population to visit public museums, but that the same visitors are somehow equally distributed throughout the country, and that therefore a region with a wider area welcoming more public.
Thus what can only be indicated is the basic homogeneity that marks in general the behavior of demand and consequently, the cultural offer in Italy.
We can see, therefore, as the number of visitors is strictly related to the amount of cultural sites that there is a direct correlation between the size of the Region and the number of visitors (and thus of total reception). If so the afflux of people into museums it is mainly conditioned from the number of cultural sites on the territory, it means that the quality of cultural programming does not have a decisive weight in consumer choice: the qualitative data it is not able to influence the demand as well as it would be desirable in a sector such as of Culture. There is therefore a kind of overall flattening of the cultural offer with the consequent need of targeted interventions on the different types of visitors.
Using the latest Istat data available, it is possible to update the statistics set out above and reach further conclusions. As far as the model in the Multiple linear regression, the results obtained do not differ from those of 2013, first presented. Here it is evident that the regions with the greatest number of government sites, such as Tuscany, Campania and Lazio, reach the highest number of visitors.
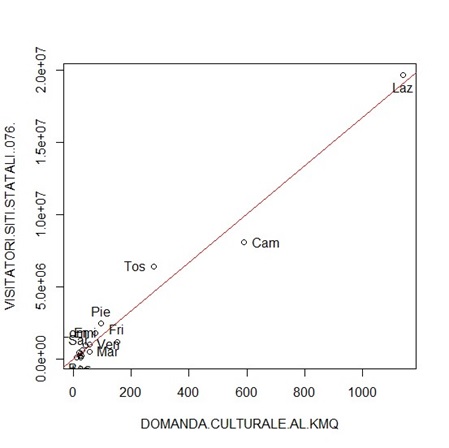
We cannot draw relevant conclusions, but only confirm what has been said, that the demand for the state museum offer can only be considered in relation to the territory. The extension of each Region and consequently, the presence of more or fewer museums on the considered surface, influence the number of average presences, which does not therefore seem to be affected by the superior or inferior proposal of this or that museum: a sign that, for better or for worse, the cultural program is not very differentiated and characteristic of a particular state site. Or maybe, more simply, the visitors go where there is more rich offer (opportunity cost).
In each case it is possible to infer that:
a) the number of visitors could be strictly related to the amount of sites: i.e. if the cultural site offer increase, visitors also increase accordingly. This is also confirmed by the cultural demand to square kilometers indicator, which measures the concentration of sites on the territory of individual regions; the higher the concentration, the more visitors.
b) the fact that the amount of visitors is tied to the number of cultural sites is a limiting factor: it can be said to perhaps denote a downgrading of the museum offer, as if it were enough to increase the total number of sites in order to have more income. We are not talking, in fact, about naked buildings, but places where culture is performed, where there are works of art which are unique and unrepeatable, different and distinguishable, each of which is part of a world in itself, a universe of thought, an aesthetic, historical era, ancient and recent knowledge, however detached from the empty container that houses it: how can any museum be equal to another?
Then perhaps this is the real problem, i.e. when one does not consider the way in which a cultural product is conceived, designed, engineered and built, when the idea prevails that creating Art in Italy is always the same, and that one museum is like another. This is like trying to understand and to quantify in numerical terms the reason why a stage attracts a large audience: it’s what is inside that is significant; it is the way it is experienced, presented, made possible.
And probably this is one of the main levers to act upon, the most important: to make the cultural offer unique and unrepeatable, defining the audience’s emotions as the only real variable which can really affect the profitability of an investment in Culture: to listen as much as possible to the sensitivity of the visitors, to their needs, because the person who visits one of Colbert’s exhibitions will not be the same as the person who chooses to see Rauschenberg. And so we have to foresee and understand these differences; we should customize the offer and make it inviting.
Because a museum is not a place to be seen, like a tableau vivant but a place to discover, to explore, to live, and passionately, to simply feel there, like every other living thing on this earth.
Footnotes
[1] Istat data 2015.
[2] Istat, Annuario statistico italiano 2015, p. 288. The document is available at http://www.istat.it/it/files/2015/12/C08.pdf .
[3] M. Maravalle, Introduzione all’analisi dei dati, Libreria Universitaria Benedetti, L’Aquila, 2007, epigraph.
[4] Reference internet site: http://www.istat.it/it/archivio/musei and http://www.statistica.beniculturali.it/
[5] It was highlighted a relationship between visitors and residents of the state sites, refuted hypothesis in this study. See in this regard the report produced by Centro Ask Bocconi and Intesa Sanpaolo, La gestione del patrimonio artistico e culturale in Italia: la relazione tra tutela e valorizzazione, 2011, pp. 59-64, available at: www.group.intesasanpaolo.com/scriptlsir0/si09/sostenibilita/ita_patrimonio_culturale.jsp
[6] The cultural demand of total assets is calculated by Istat as the sum of state museums’ visitors and non-state museums’ visitors. Household spending for culture includes services provided by theaters, television and radio activities other entertainment (discos, games rooms, fairs and amusement parks), the services provided by libraries, archives, museums and other cultural activities sports; finally, it includes remuneration of the service of gambling (including lotto, lotteries and bingo halls). The total expenditure in the sector is calculated as the sum of current expenditure and investments made by municipalities, provinces and regions for the cultural sector in the reference years.
[7] For a discussion on the issues of Multiple linear regression, see D. Piccolo, Statistica, Il Mulino, Bologna, 2000, and A. De Luca, Le applicazioni dei metodi statistici alle analisi di mercato. Manuale di Ricerche per il Marketing, FrancoAngeli, Milan, 2006.
[8] In this regard we show the data made available by the Council of Europe and processed with the help of the Hertie School of Governance and the European Cultural Foundation, The Indicator Framework on Culture and Democracy, available at the following link: https: //www.hertie -school.org/fileadmin/governancereport/ifcd/#
[9] The first part of this paper is taken from my thesis in Economics, Multiple linear regression and market analysis. The artistic heritage in Italy, under the supervision of, Prof. M. Maravalle, University of L’Aquila, Italy.
[10] The index R2 is used to measure the goodness of a model, which will be greater the more this index tends to 1. In Regression models without intercept (in which the value of the constant is less than that is, in absolute value, 2) the adjusted R2 index is used which, also in this case, must approximate as possible to the unit to explain a statistically significant model.
[11] Student’s T test shows significant levels of non-independence between two variables if values in form more than 2 are taken. It is an index that measures the impact of the variables considered.
[12] One that is able to provide evidence of a greater and consistent link with the variable related to the state museums’ visitors.
[13] Available in the file Beni Culturali related to the Indicatori territoriali per le politiche di sviluppo, downloadable at http://www.istat.it/it/archivio/16777 .
Bibliographical references
[a] Maravalle M., Introduzione all’analisi dei dati, Libreria Universitaria Benedetti, L’Aquila, 2007.
[b] Centro Ask Bocconi and Intesa Sanpaolo, La gestione del patrimonio artistico e culturale in Italia: la relazione tra tutela e valorizzazione, 2011.
[c] Piccolo D., Statistica, Il Mulino, Bologna, 2000.
[d] De Luca A., Le applicazioni dei metodi statistici alle analisi di mercato. Manuale di Ricerche per il Marketing, FrancoAngeli, Milan, 2006.
[e] Trimarchi M., Segre G., Santagata W., Economia della cultura: la prospettiva italiana, in Economia della cultura n. 4, 2007.
Websites consulted
[a] http://www.istat.it/it/archivio/musei [regarding the Istat data on museums].
[b] http://www.statistica.beniculturali.it/ [for Mibact data].
[c] https://www.hertie-school.org/fileadmin/governancereport/ifcd/# [on the study of indicators for European cultural policies].
[d] http://www.istat.it/it/archivio/16777 [for Istat indicators on development policies].

